EDX-7200
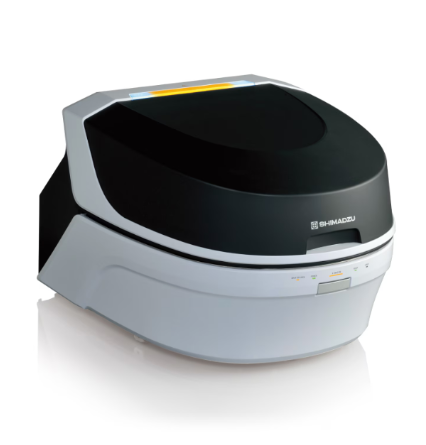
The EDX-7200 is a flagship model of the EDX series in pursuit of high sensitivity, high speed and high precision. This model supports new regulations and directives for consumer and environmental compliance, such as RoHS/ELV, REACH, and TSCA with full exclusive screening analysis kits.
Producer:
Product Description
The EDX-7200 is a flagship model of the EDX series in pursuit of high sensitivity, high speed and high precision. This model supports new regulations and directives for consumer and environmental compliance, such as RoHS/ELV, REACH, and TSCA with full exclusive screening analysis kits.
Technical specifications
Supports Various Applications in Many Fields
-
■Electrical/electronic materials
- RoHS and halogen screening
- Thin-film analysis for semiconductors, discs, liquid crystals, and solar cells
■Automobiles and machinery
- ELV hazardous element screening
- Composition analysis, plating thickness measurement, and chemical conversion coating film weight measurement for machine parts
■Ferrous/non-ferrous metals
- Main component analysis and impurity analysis of raw materials, alloys, solder, and precious metals
- Composition analysis of slag
■Mining
- Grade analysis for mineral processing
■Ceramics
- Analysis of ceramics, cement, glass, bricks, and clay
■Oil and petrochemicals
- Analysis of sulfur in oil
- Analysis of additive elements and mixed elements in lubricating oil
-
■Chemicals
- Analysis of products and organic/inorganic raw materials
- Analysis of catalysts, pigments, paints, rubber, and plastics
■Environment
- Analysis of soil, effluent, combustion ash, filters, and fine particulate matter
■Pharmaceuticals
- Analysis of residual catalyst during synthesis
- Analysis of impurities and foreign matter in active pharmaceutical ingredients
■Agriculture and foods
- Analysis of soil, fertilizer, and plants
- Analysis of raw ingredients, control of added elements, and analysis of foreign matter in foods
■Other
- Composition analysis of archeological samples and precious stones, analysis of toxic heavy metals in toys and everyday goods
Principle of Fluorescent X-ray Generation
Electron Paths and Principle of X-ray Generation Expressed as a Bohr Model
When a sample is irradiated with X-rays from an X-ray tube, the atoms in the sample generate unique X-rays that are emitted from the sample.
EDX-7200 for High Speed, High Sensitivity and High Accuracy
High Speed - Throughput Increased by Up to a Factor of 30 -
Equipped with a high-speed circuit that increase the count rate by up to 30 times compared to the former model (EDX-720).
Improved algorithms and improved performance also help to reduce measurement times.
High Sensitivity - Improves Lower Detection Limit by Up to 6 Times -
In metals analysis, the lower detection limit of trace elements in main components has been improved.
High Resolution
High Resolution
- EDX-7200 offers superior energy resolution compared to previous models by incorporating a state-of-the-art SDD detector.
This reduces the effects of overlapping peaks of different elements, enhancing the reliability of the analysis results.
No Liquid Nitrogen Required
The SDD detector is capable of electronic cooling. Since there is no need to use liquid nitrogen, it reduces running costs.
Automatic Replacement of Five Primary Filters
Primary filters enhance detection sensitivity by reducing the continuous X-rays and the characteristic X-rays from the X-ray tube.
Freely Combine Collimators and Primary Filters
The collimators and primary filters are driven independently and can be combined to address specific requirements. Select the optimal combination from 24 (6 filters x 4 collimators) available options.
Vacuum Measurement Unit and Helium Purge Unit (Option)
Sensitivity for light elements can be increased by removing atmosphere. Two options are available: a vacuum measurement unit and a helium purge unit.
Calibration Curve Method
Fundamental Parameter (FP) Method
Film FP Method
Background FP Method
Matching Function