Nexera UC Prep
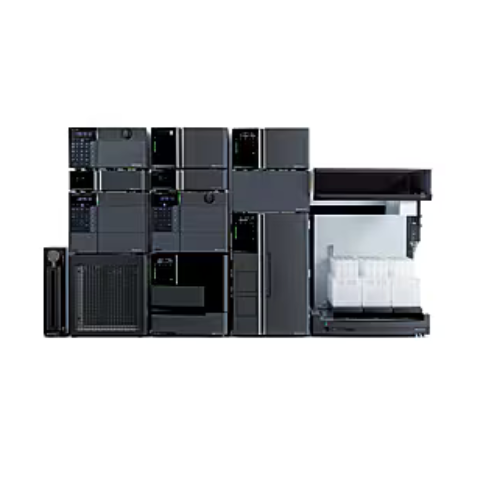
The Nexera™ UC Prep is a new preparative supercritical fluid chromatography (SFC) system that offers both the high basic performance developed for the previous Nexera UC model and original state-of-the-art preparative SFC technologies. It resolves a number of issues in preparative tasks, reducing labor and improving efficiency while fitting into pre-existing workflows. Not only does the Nexera UC Prep achieve superior recovery rates for purification, it provides flexible system configurations in a compact design, requiring low installation space and allowing you to maximize lab resources.
Unparalleled performance, unparalleled flexibility
Category:
Producer:
Product Description
The Nexera™ UC Prep is a new preparative supercritical fluid chromatography (SFC) system that offers both the high basic performance developed for the previous Nexera UC model and original state-of-the-art preparative SFC technologies. It resolves a number of issues in preparative tasks, reducing labor and improving efficiency while fitting into pre-existing workflows. Not only does the Nexera UC Prep achieve superior recovery rates for purification, it provides flexible system configurations in a compact design, requiring low installation space and allowing you to maximize lab resources.
Unparalleled performance, unparalleled flexibility
Technical specifications
SFC shortens analysis times
Due to the low viscosity and high diffusivity of supercritical CO2, column back pressure for supercritical fluid chromatography supercritical fluid chromatography (SFC) is low even at high flow rates which enables faster analysis without sacrificing column efficiency. This allows significantly shorter analysis times than HPLC.
In purification using SFC, the target compounds are recovered in high concentrations in an organic solvent, which saves time not only during analysis, but also during post-run processing after preparative tasks are complete. The Nexera™ UC Prep maximizes fractionation output with its high recovery rates and ability to carry out continuous preparative work that further shortens the user's waiting time.
High recovery rates
In preparative SFC, one factor that results in lower recovery rates is increased scattering of the eluent when the CO2 returns from a supercritical to a gaseous state. The Nexera UC Prep's patented gas-liquid separator, the LotusStream separator, successfully reduces sample dispersion and carryover, while also achieving high recovery rates. These high recovery rates can be obtained regardless of flow rate or modifier concentration, even for volatile compounds such as the fragrance linalool.
Stacked injection function eliminates waiting time
Normal injection wastes time between peak elutions. Using the Nexera UC Prep’s stacked injection function, samples can be injected continuously without any waiting time, enabling more samples to be processed. Settings for this function can be specified easily in the dedicated software Prep Solution.
Simple post-run processing
Because most of the mobile phase is vaporized supercritical CO2, only the organic solvent (modifier) added to change the polarity of the mobile phase remains after preparative work. Since there is no water content in the recovery fraction, the concentration time is significantly shorter.
Solid autosamplers for increasing loading capacity
More of the target compound can be fractionated at once by loading a large volume. However, this can sometimes lead to poor separation and broad peak shapes because of sample solvent effects. By performing fractionation with the on-line SFE-SFC, solid samples can be enclosed in an extraction vessel and extracted directly without dissolving in a solvent. A good peak shape prevents simultaneous elution of contaminants and improves the purity of the target component.
Prep Solutions enables a seamless preparative workflow
The dedicated software, Prep Solution, ensures that it is simple to scale up from an analytical to a preparative workflow, and makes it easy to configure parameter settings. It greatly increases the efficiency of preparative workflows.
Wide range of flow rates available
In a single system, the Nexera UC Prep can handle ow rates from 10 to 150 mL/min for fractionation of a range of sample sizes, from a few hundred mg up to a few grams. Shimadzu provides various preparative systems, such as Nexera UC/s, which can perform SFC analysis and UHPLC analysis using a single system. The system corresponding to the application can be selected.
Maximize fractionation output and labor-savings
On-line extraction, separation, and fractionation are possible by connecting a fraction collector at the end of the detector. Furthermore, scale-up from analytical to preparative scale increases the volume of fractions. The Nexera UC Prep SFE unit (maximum ow rate: 150 mL/min) with a preparative column enables high-volume extraction. On-line SFE-SFC can automatically run the extraction, purification and fractionation continuously day or night. The target compounds are recovered in high concentrations in an organic solvent, saving time during post-run processing after preparative tasks are complete.
Nexera UC reduces environmental impact
Comparison of costs and consumption of organic solvent for a single analysis by conventional normal-phase LC vs. SFC is shown below. By using SFC, the total cost of analysis is reduced by 87.6% and the consumption of organic solvent is reduced by 94.2%.